Maps and layers and more!

Maps and layers and more
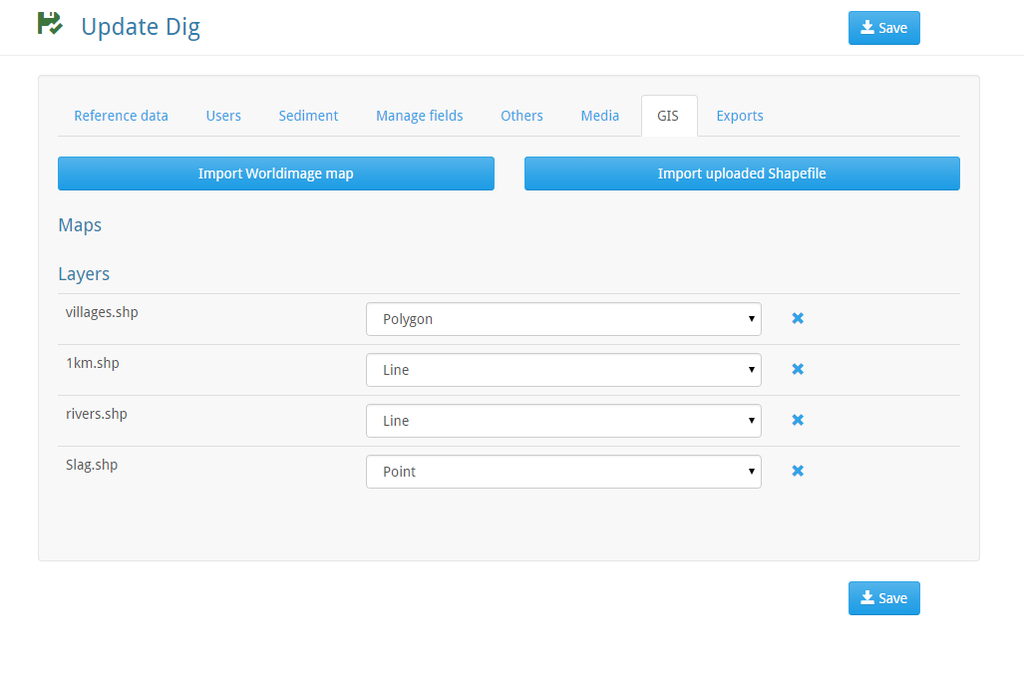
One goal of Inari is to visualize your data conveniently. This is great at the excavation as you get a good overview where new artefacts or contexts are found and it is great for publication. This is the first step towards great features that will help you to add distribution maps, overviews and much more with a simple click to your publication and that will also make documenting on the excavations easier. To achieve this we added a geovisualisation tool to our software. It will enable you to visualise your excavation via shapefile layers (more data formats will be added later), especially showing your artefacts and their distribution and your archaeological records. This will make it easier for you and others to get an overview and track certain developments and to design distribution maps. Since all of your artefacts and contexts would be added to the maps you can easily spot workshops or other areas of agglomeration and they are by this time ready for use in your publication.
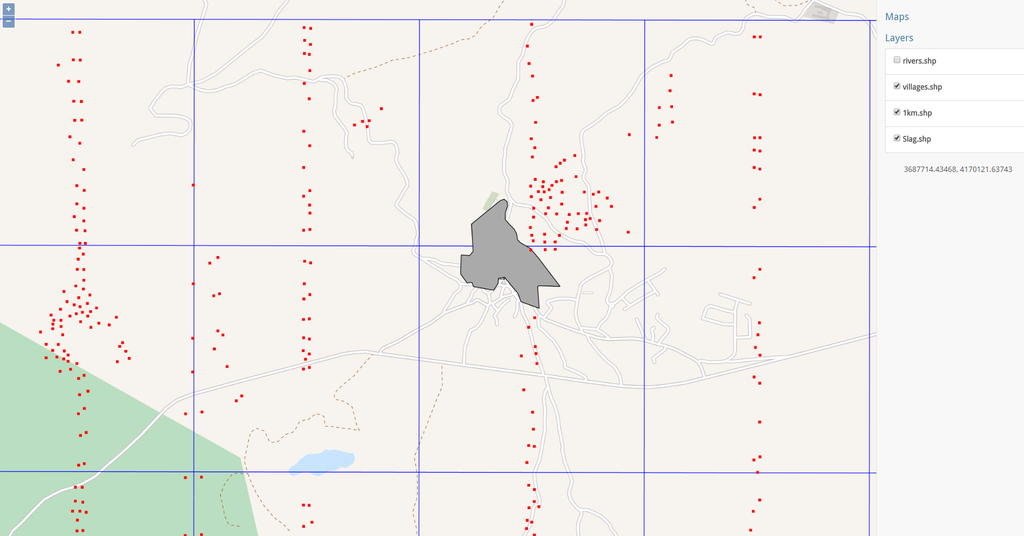
Inari gives you the possibility to integrate your own detailed maps, drawings, and finds into a world map in order to create an overview and it will give you the exact coordinates when moving the mouse across your points. You will be able to add individual finds, interfaces, and layers. This blog is meant as a quick overview over our new feature. If you want to try it out by yourself, however, feel free to click on the demo button at www.inari-software.com. There you will see an example of how our geovisualisation will work.
As we are constantly trying to improve our features we will add statistic and temporal features to our geovisualisation, meaning you can track your finds through various periods as well as get a statistical evaluation of them. Also coming soon will be little pop-up windows that will tell you every detail about the find if you move your mouse over its coordinate on the map. By clicking it you will be transferred to the datasheet of the find or the layer itself in your excavation. The same will be done with your features consisting of polylines. The display of maps and shapefiles in Inari is therefore just the first step to a very elaborate tool that will help you make your archaeological research visible and presentable with only a few very easy steps.
Our reference for the GIS- Data in the demo is: GIS-Data by A Bernard Knapp, Michael Given (2003) The Sydney Cyprus Survey Project [data-set]. York: Archaeology Data Service [distributor] http://dx.doi.org/10.5284/1000208 Ricarda Meisl & N.S. Debenjak